1.1 Graphing a Linear Equation
- Graph a line when you know its equation
- Graph a line when you are given its equation in parametric form
- Graph and find equations of vertical and horizontal lines
Why bother graphing lines? In the real world, linear relationships are everywhere. If you run a business, a line might show how your total cost increases as you produce more items. In healthcare, a line might track how a patient's recovery progresses over time. In engineering, lines help model stress and strain on materials. Learning to graph lines gives you a visual tool for making predictions and spotting trends quickly.
Graphing a Line from Its Equation
We call equations whose graphs are straight lines linear equations. The following are all examples of linear equations:
\[ 2x - 3y = 6, \quad 3x = 4y - 7, \quad y = 2x - 5, \quad 2y = 3, \quad \text{and} \quad x - 2 = 0 \]
A line is completely determined by two points. Therefore, to graph a linear equation, we need to find the coordinates of at least two points on that line. We can do this by choosing any value for \(x\) or \(y\) and then solving for the other variable.
Think of graphing like finding treasure markers. If you have the equation (the map), you can plug in any \(x\) value (a guess along the horizontal) to find the corresponding \(y\) value (the vertical location). Mark two spots, draw a straight edge between them, and you've found your line!
Problem Statement
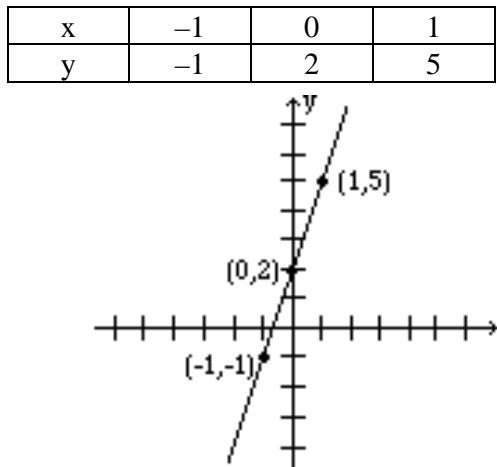
Graph the line: \(y = 3x + 2\)
Example 1.1.1 Solution
We need to find the coordinates of at least two points. We arbitrarily choose \(x = -1\), \(x = 0\), and \(x = 1\).
If \(x = -1\), then \(y = 3(-1) + 2 = -1\). Therefore, \((-1, -1)\) is a point on this line.
If \(x = 0\), then \(y = 3(0) + 2 = 2\). Hence we get the point \((0, 2)\).
If \(x = 1\), then \(y = 3(1) + 2 = 5\), giving us the point \((1, 5)\).
Below, the results are summarized, and the line is graphed.
Problem Statement
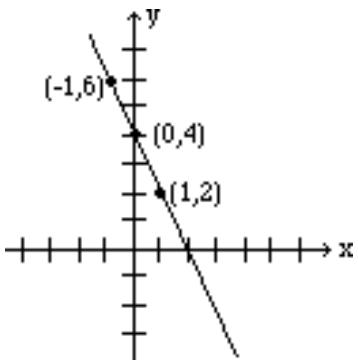
Graph the line: \(2x + y = 4\)
Example 1.1.2 Solution
Again, we need to find coordinates of at least two points.
We arbitrarily choose \(x = -1\), \(x = 0\), and \(y = 2\).
If \(x = -1\), then \(2(-1) + y = 4\), which results in \(y = 6\).
Therefore, \((-1, 6)\) is a point on this line.
If \(x = 0\), then \(2(0) + y = 4\), which results in \(y = 4\). Hence the point \((0, 4)\).
If \(y = 2\), then \(2x + 2 = 4\), which yields \(x = 1\), and gives the point \((1, 2)\).
The table below shows the points, and the line is graphed.
| \(x\) | -1 | 0 | 1 |
|---|---|---|---|
| \(y\) | 6 | 4 | 2 |
Intercepts
The points at which a line crosses the coordinate axes are called the intercepts. The x-intercept is where the line crosses the x-axis (where \(y = 0\)), and the y-intercept is where the line crosses the y-axis (where \(x = 0\)).
When we graph a line by plotting two points, using the intercepts is often preferred because they are easy to find and they clearly show where the line meets each axis.
To find the value of the x-intercept, we let \(y = 0\) and solve for \(x\).
To find the value of the y-intercept, we let \(x = 0\) and solve for \(y\).
Intercepts tell us where a relationship "starts" or "breaks even." In business, the x-intercept often shows when you recoup your investment (profit = 0). The y-intercept might show your startup costs before selling anything. In physics, the y-intercept could be the initial position of an object before motion begins.
Problem Statement
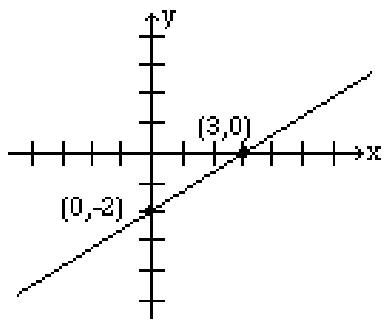
Find the intercepts of the line \(2x - 3y = 6\), and graph.
Example 1.1.3 Solution
To find the x-intercept, let \(y = 0\) in the equation, and solve for \(x\).
\[ 2x - 3(0) = 6 \]
\[ 2x = 6 \]
\[ x = 3 \]
Therefore, the x-intercept is the point \((3, 0)\).
To find the y-intercept, let \(x = 0\) in the equation, and solve for \(y\).
\[ 2(0) - 3y = 6 \]
\[ -3y = 6 \]
\[ y = -2 \]
Therefore, the y-intercept is the point \((0, -2)\).
To graph the line, plot the points for the x-intercept \((3, 0)\) and the y-intercept \((0, -2)\), and use them to draw the line.
Graphing a Line from Its Equation in Parametric Form
In higher mathematics, we sometimes write equations of lines in parametric form. For example:
\[ x = 3 + 2t, \quad y = 1 + t \]
The letter \(t\) is called the parameter (or dummy variable). Both \(x\) and \(y\) are expressed as separate functions of this third variable \(t\).
Parametric lines can be graphed by substituting numerical values for \(t\) to find corresponding values for \(x\) and \(y\). We then plot the points using their \((x, y)\) coordinates and draw the line through them.
Why use a parameter? In physics and computer animation, \(t\) often represents time. Instead of asking "where is the object?" we ask "where is the object at time \(t\)?" Parametric equations let us track motion along a path and control the speed and direction of movement—something we can't easily do with standard \(y = mx + b\) form.
Problem Statement
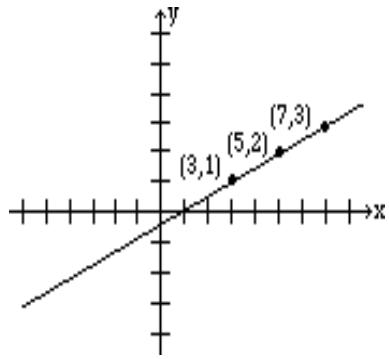
Graph the line given by the parametric equations: \(x = 3 + 2t\), \(y = 1 + t\)
Example 1.1.4 Solution
Let \(t = 0\), \(1\), and \(2\). For each value of \(t\), we find the corresponding values for \(x\) and \(y\). The results are given in the table below.
| \(t\) | \(x\) | \(y\) | Point on Line |
|---|---|---|---|
| 0 | 3 | 1 | \((3, 1)\) |
| 1 | 5 | 2 | \((5, 2)\) |
| 2 | 7 | 3 | \((7, 3)\) |
Horizontal and Vertical Lines
When an equation of a line has only one variable, the resulting graph is a horizontal or a vertical line.
The graph of the line \(x = a\), where \(a\) is a constant, is a vertical line that passes through the point \((a, 0)\). Every point on this line has the \(x\)-coordinate equal to \(a\), regardless of the \(y\)-coordinate.
The graph of the line \(y = b\), where \(b\) is a constant, is a horizontal line that passes through the point \((0, b)\). Every point on this line has the \(y\)-coordinate equal to \(b\), regardless of the \(x\)-coordinate.
Problem Statement
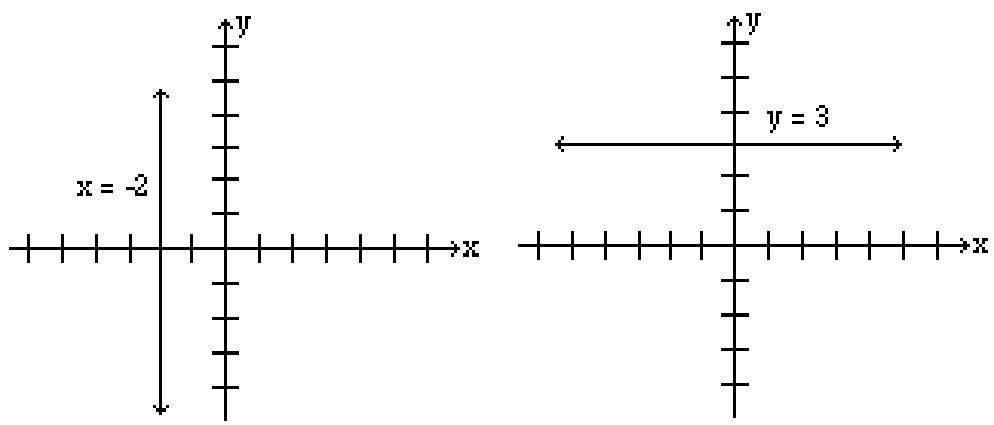
Graph the lines: \(x = -2\), and \(y = 3\).
Solution:
The graph of the line \(x = -2\) is a vertical line that has the x-coordinate \(-2\) no matter what the y-coordinate is. The graph is a vertical line passing through point \((-2, 0)\).
The graph of the line \(y = 3\) is a horizontal line that has the y-coordinate 3 regardless of what the x-coordinate is. Therefore, the graph is a horizontal line that passes through point \((0, 3)\).
Most students feel that the coordinates of points must always be integers. This is not true! In real-world situations, measurements are rarely perfect whole numbers. Do not be intimidated if your points include fractions or decimals—accurate graphs often require them. A line passing through \((1.5, 2.75)\) is just as valid as one passing through \((1, 2)\).
Problem Set 1.1
Work the following problems.
1) Is the point \((2, 3)\) on the line \(5x - 2y = 4\)?
Problem 1 Solution
Problem 1 Solution: Step 1: Substitute the given point \((2, 3)\) into the equation \(5x - 2y = 4\) to check whether the left-hand side equals the right-hand side. \[5(2) - 2(3) = 10 - 6 = 4\] Step 2: Compare to the right-hand side of the equation. \[4 = 4 \quad \checkmark\] Since both sides are equal, the point satisfies the equation. Answer: Yes, the point \((2, 3)\) is on the line \(5x - 2y = 4\). Verification: \(5(2) - 2(3) = 10 - 6 = 4 = 4\) ✓2) Is the point \((1, -2)\) on the line \(6x - y = 4\)?
Problem 2 Solution
Problem 2 Solution: Step 1: Substitute the given point \((1, -2)\) into the equation \(6x - y = 4\) to check whether the left-hand side equals the right-hand side. \[6(1) - (-2) = 6 + 2 = 8\] Step 2: Compare to the right-hand side of the equation. \[8 \neq 4\] Since the left-hand side does not equal the right-hand side, the point does not satisfy the equation. Answer: No, the point \((1, -2)\) is not on the line \(6x - y = 4\). Verification: \(6(1) - (-2) = 8 \neq 4\) ✓3) For the line \(3x - y = 12\), complete the following ordered pairs. \((2, \quad)\) \((\quad, 6)\) \((0, \quad)\) \((\quad, 0)\)
Problem 3 Solution
Problem 3 Solution: We use the equation \(3x - y = 12\) and substitute the known coordinate to solve for the unknown one. Step 1: Find \(y\) when \(x = 2\). \[3(2) - y = 12\] \[6 - y = 12\] \[-y = 6\] \[y = -6\] The ordered pair is \((2, -6)\). Step 2: Find \(x\) when \(y = 6\). \[3x - 6 = 12\] \[3x = 18\] \[x = 6\] The ordered pair is \((6, 6)\). Step 3: Find \(y\) when \(x = 0\) (the y-intercept). \[3(0) - y = 12\] \[-y = 12\] \[y = -12\] The ordered pair is \((0, -12)\). Step 4: Find \(x\) when \(y = 0\) (the x-intercept). \[3x - 0 = 12\] \[3x = 12\] \[x = 4\] The ordered pair is \((4, 0)\). Answer: \((2, -6)\), \((6, 6)\), \((0, -12)\), \((4, 0)\) Verification: - \(3(2) - (-6) = 6 + 6 = 12\) ✓ - \(3(6) - 6 = 18 - 6 = 12\) ✓ - \(3(0) - (-12) = 0 + 12 = 12\) ✓ - \(3(4) - 0 = 12\) ✓4) For the line \(4x + 3y = 24\), complete the following ordered pairs. \((3, \quad)\) \((\quad, 4)\) \((0, \quad)\) \((\quad, 0)\)
Problem 4 Solution
Problem 4 Solution: We use the equation \(4x + 3y = 24\) and substitute the known coordinate to solve for the unknown one. Step 1: Find \(y\) when \(x = 3\). \[4(3) + 3y = 24\] \[12 + 3y = 24\] \[3y = 12\] \[y = 4\] The ordered pair is \((3, 4)\). Step 2: Find \(x\) when \(y = 4\). \[4x + 3(4) = 24\] \[4x + 12 = 24\] \[4x = 12\] \[x = 3\] The ordered pair is \((3, 4)\). Note: Both conditions lead to the same point \((3, 4)\). Step 3: Find \(y\) when \(x = 0\) (the y-intercept). \[4(0) + 3y = 24\] \[3y = 24\] \[y = 8\] The ordered pair is \((0, 8)\). Step 4: Find \(x\) when \(y = 0\) (the x-intercept). \[4x + 3(0) = 24\] \[4x = 24\] \[x = 6\] The ordered pair is \((6, 0)\). Answer: \((3, 4)\), \((3, 4)\), \((0, 8)\), \((6, 0)\) Verification: - \(4(3) + 3(4) = 12 + 12 = 24\) ✓ - \(4(0) + 3(8) = 0 + 24 = 24\) ✓ - \(4(6) + 3(0) = 24 + 0 = 24\) ✓5) Graph \(y = 2x + 3\)
Problem 5 Solution
Problem 5 Solution: To graph the line, we find at least two points by choosing values for \(x\) and computing \(y\). Step 1: Choose \(x = -1\). \[y = 2(-1) + 3 = -2 + 3 = 1\] Point: \((-1, 1)\) Step 2: Choose \(x = 0\). \[y = 2(0) + 3 = 0 + 3 = 3\] Point: \((0, 3)\) — this is the y-intercept. Step 3: Choose \(x = 1\). \[y = 2(1) + 3 = 2 + 3 = 5\] Point: \((1, 5)\) Step 4: Plot the points \((-1, 1)\), \((0, 3)\), and \((1, 5)\) on the coordinate plane and draw a straight line through them. The line has slope \(2\) and y-intercept \(3\).| \(x\) | \(-1\) | \(0\) | \(1\) |
| \(y\) | \(1\) | \(3\) | \(5\) |
6) Graph \(y = -3x + 5\)
Problem 6 Solution
Problem 6 Solution: To graph the line, we find at least two points by choosing values for \(x\) and computing \(y\). Step 1: Choose \(x = 0\). \[y = -3(0) + 5 = 5\] Point: \((0, 5)\) — this is the y-intercept. Step 2: Choose \(x = 1\). \[y = -3(1) + 5 = -3 + 5 = 2\] Point: \((1, 2)\) Step 3: Choose \(x = 2\). \[y = -3(2) + 5 = -6 + 5 = -1\] Point: \((2, -1)\) Step 4: Plot the points \((0, 5)\), \((1, 2)\), and \((2, -1)\) on the coordinate plane and draw a straight line through them. The line has slope \(-3\) and y-intercept \(5\).| \(x\) | \(0\) | \(1\) | \(2\) |
| \(y\) | \(5\) | \(2\) | \(-1\) |
7) Graph \(y = 4x - 3\)
Problem 7 Solution
Problem 7 Solution: To graph the line, we find at least two points by choosing values for \(x\) and computing \(y\). Step 1: Choose \(x = 0\). \[y = 4(0) - 3 = -3\] Point: \((0, -3)\) — this is the y-intercept. Step 2: Choose \(x = 1\). \[y = 4(1) - 3 = 4 - 3 = 1\] Point: \((1, 1)\) Step 3: Choose \(x = 2\). \[y = 4(2) - 3 = 8 - 3 = 5\] Point: \((2, 5)\) Step 4: Plot the points \((0, -3)\), \((1, 1)\), and \((2, 5)\) on the coordinate plane and draw a straight line through them. The line has slope \(4\) and y-intercept \(-3\).| \(x\) | \(0\) | \(1\) | \(2\) |
| \(y\) | \(-3\) | \(1\) | \(5\) |
8) Graph \(x - 2y = 8\)
Problem 8 Solution
Problem 8 Solution: We graph this line by finding its intercepts. Step 1: Find the x-intercept by setting \(y = 0\). \[x - 2(0) = 8\] \[x = 8\] x-intercept: \((8, 0)\) Step 2: Find the y-intercept by setting \(x = 0\). \[0 - 2y = 8\] \[-2y = 8\] \[y = -4\] y-intercept: \((0, -4)\) Step 3: Find a third point for accuracy. Choose \(x = 4\). \[4 - 2y = 8\] \[-2y = 4\] \[y = -2\] Point: \((4, -2)\) Step 4: Plot the intercepts \((8, 0)\) and \((0, -4)\) along with the check point \((4, -2)\). Draw a straight line through them. The slope is \(m = \frac{0 - (-4)}{8 - 0} = \frac{4}{8} = \frac{1}{2}\).| \(x\) | \(0\) | \(4\) | \(8\) |
| \(y\) | \(-4\) | \(-2\) | \(0\) |
9) Graph \(2x + y = 4\)
Problem 9 Solution
Problem 9 Solution: We graph this line by finding its intercepts. Step 1: Find the x-intercept by setting \(y = 0\). \[2x + 0 = 4\] \[2x = 4\] \[x = 2\] x-intercept: \((2, 0)\) Step 2: Find the y-intercept by setting \(x = 0\). \[2(0) + y = 4\] \[y = 4\] y-intercept: \((0, 4)\) Step 3: Find a third point for accuracy. Choose \(x = 1\). \[2(1) + y = 4\] \[2 + y = 4\] \[y = 2\] Point: \((1, 2)\) Step 4: Plot the intercepts \((2, 0)\) and \((0, 4)\) along with the check point \((1, 2)\). Draw a straight line through them. The slope is \(m = \frac{0 - 4}{2 - 0} = \frac{-4}{2} = -2\).| \(x\) | \(0\) | \(1\) | \(2\) |
| \(y\) | \(4\) | \(2\) | \(0\) |
10) Graph \(2x - 3y = 6\)
Problem 10 Solution
Problem 10 Solution: We graph this line by finding its intercepts. Step 1: Find the x-intercept by setting \(y = 0\). \[2x - 3(0) = 6\] \[2x = 6\] \[x = 3\] x-intercept: \((3, 0)\) Step 2: Find the y-intercept by setting \(x = 0\). \[2(0) - 3y = 6\] \[-3y = 6\] \[y = -2\] y-intercept: \((0, -2)\) Step 3: Find a third point for accuracy. Choose \(x = 6\). \[2(6) - 3y = 6\] \[12 - 3y = 6\] \[-3y = -6\] \[y = 2\] Point: \((6, 2)\) Step 4: Plot the intercepts \((3, 0)\) and \((0, -2)\) along with the check point \((6, 2)\). Draw a straight line through them. The slope is \(m = \frac{0 - (-2)}{3 - 0} = \frac{2}{3}\).| \(x\) | \(0\) | \(3\) | \(6\) |
| \(y\) | \(-2\) | \(0\) | \(2\) |
11) Graph \(2x + 4 = 0\)
Problem 11 Solution
Problem 11 Solution: Step 1: Solve the equation for \(x\). \[2x + 4 = 0\] \[2x = -4\] \[x = -2\] Step 2: Recognize the type of line. The equation \(x = -2\) contains only the variable \(x\). By Definition 1.1.4, this is a vertical line passing through \((-2, 0)\). Step 3: To graph, draw a vertical line that crosses the x-axis at \(x = -2\). Every point on this line has \(x\)-coordinate \(-2\), regardless of the \(y\)-coordinate. For example:| \(x\) | \(-2\) | \(-2\) | \(-2\) |
| \(y\) | \(-2\) | \(0\) | \(3\) |
12) Graph \(2y - 6 = 0\)
Problem 12 Solution
Problem 12 Solution: Step 1: Solve the equation for \(y\). \[2y - 6 = 0\] \[2y = 6\] \[y = 3\] Step 2: Recognize the type of line. The equation \(y = 3\) contains only the variable \(y\). By Definition 1.1.4, this is a horizontal line passing through \((0, 3)\). Step 3: To graph, draw a horizontal line that crosses the y-axis at \(y = 3\). Every point on this line has \(y\)-coordinate \(3\), regardless of the \(x\)-coordinate. For example:| \(x\) | \(-2\) | \(0\) | \(4\) |
| \(y\) | \(3\) | \(3\) | \(3\) |
13) Graph the following three equations on the same set of coordinate axes. \(y = x + 1\) \(y = 2x + 1\) \(y = -x + 1\)
Problem 13 Solution
Problem 13 Solution: We find key points for each line, then graph all three on the same axes. Step 1: Line 1 — \(y = x + 1\) Choose \(x = -1\): \(y = -1 + 1 = 0\) → \((-1, 0)\) Choose \(x = 0\): \(y = 0 + 1 = 1\) → \((0, 1)\) Choose \(x = 1\): \(y = 1 + 1 = 2\) → \((1, 2)\) Slope \(m = 1\), y-intercept \((0, 1)\). Step 2: Line 2 — \(y = 2x + 1\) Choose \(x = -1\): \(y = 2(-1) + 1 = -1\) → \((-1, -1)\) Choose \(x = 0\): \(y = 2(0) + 1 = 1\) → \((0, 1)\) Choose \(x = 1\): \(y = 2(1) + 1 = 3\) → \((1, 3)\) Slope \(m = 2\), y-intercept \((0, 1)\). Step 3: Line 3 — \(y = -x + 1\) Choose \(x = -1\): \(y = -(-1) + 1 = 2\) → \((-1, 2)\) Choose \(x = 0\): \(y = -(0) + 1 = 1\) → \((0, 1)\) Choose \(x = 1\): \(y = -(1) + 1 = 0\) → \((1, 0)\) Slope \(m = -1\), y-intercept \((0, 1)\). Step 4: Observations and Graphing All three lines share the same y-intercept \((0, 1)\) but have different slopes: - \(y = x + 1\): slope \(1\) (rises at 45°) - \(y = 2x + 1\): slope \(2\) (steeper, rises faster) - \(y = -x + 1\): slope \(-1\) (falls at 45°) Plot all points and draw the three lines through the common point \((0, 1)\). Answer: Three lines intersecting at \((0, 1)\) with slopes \(1\), \(2\), and \(-1\). Lines with the same y-intercept but different slopes fan out from the shared point. Verification: - \(y = x + 1\): at \(x = 0\), \(y = 1\) ✓ - \(y = 2x + 1\): at \(x = 0\), \(y = 1\) ✓ - \(y = -x + 1\): at \(x = 0\), \(y = 1\) ✓14) Graph the following three equations on the same set of coordinate axes. \(y = 2x + 1\) \(y = 2x\) \(y = 2x - 1\)
Problem 14 Solution
Problem 14 Solution: We find key points for each line, then graph all three on the same axes. Step 1: Line 1 — \(y = 2x + 1\) Choose \(x = 0\): \(y = 2(0) + 1 = 1\) → \((0, 1)\) Choose \(x = 1\): \(y = 2(1) + 1 = 3\) → \((1, 3)\) Slope \(m = 2\), y-intercept \((0, 1)\). Step 2: Line 2 — \(y = 2x\) Choose \(x = 0\): \(y = 2(0) = 0\) → \((0, 0)\) Choose \(x = 1\): \(y = 2(1) = 2\) → \((1, 2)\) Slope \(m = 2\), y-intercept \((0, 0)\) (the origin). Step 3: Line 3 — \(y = 2x - 1\) Choose \(x = 0\): \(y = 2(0) - 1 = -1\) → \((0, -1)\) Choose \(x = 1\): \(y = 2(1) - 1 = 1\) → \((1, 1)\) Slope \(m = 2\), y-intercept \((0, -1)\). Step 4: Observations and Graphing All three lines have the same slope \(m = 2\) but different y-intercepts: - \(y = 2x + 1\): y-intercept at \((0, 1)\) - \(y = 2x\): y-intercept at \((0, 0)\) - \(y = 2x - 1\): y-intercept at \((0, -1)\) Since the slopes are equal and the y-intercepts differ, these three lines are parallel — they will never intersect. Plot the points and draw three parallel lines. Answer: Three parallel lines with slope \(m = 2\), crossing the y-axis at \(y = 1\), \(y = 0\), and \(y = -1\) respectively. Same slope + different intercepts = parallel lines. Verification: - \(y = 2x + 1\): at \(x = 1\), \(y = 3\) ✓ - \(y = 2x\): at \(x = 1\), \(y = 2\) ✓ - \(y = 2x - 1\): at \(x = 1\), \(y = 1\) ✓15) Graph the line using the parametric equations \(x = 1 + 2t\), \(y = 3 + t\)
Problem 15 Solution
Problem 15 Solution: To graph a line given in parametric form, we substitute several values of \(t\) to find \((x, y)\) points. Step 1: Let \(t = 0\). \[x = 1 + 2(0) = 1, \quad y = 3 + 0 = 3\] Point: \((1, 3)\) Step 2: Let \(t = 1\). \[x = 1 + 2(1) = 3, \quad y = 3 + 1 = 4\] Point: \((3, 4)\) Step 3: Let \(t = 2\). \[x = 1 + 2(2) = 5, \quad y = 3 + 2 = 5\] Point: \((5, 5)\) Step 4: Organize and plot.| \(t\) | \(x\) | \(y\) | Point |
| \(0\) | \(1\) | \(3\) | \((1, 3)\) |
| \(1\) | \(3\) | \(4\) | \((3, 4)\) |
| \(2\) | \(5\) | \(5\) | \((5, 5)\) |
16) Graph the line using the parametric equations \(x = 2 - 3t\), \(y = 1 + 2t\)
Problem 16 Solution
Problem 16 Solution: To graph a line given in parametric form, we substitute several values of \(t\) to find \((x, y)\) points. Step 1: Let \(t = 0\). \[x = 2 - 3(0) = 2, \quad y = 1 + 2(0) = 1\] Point: \((2, 1)\) Step 2: Let \(t = 1\). \[x = 2 - 3(1) = -1, \quad y = 1 + 2(1) = 3\] Point: \((-1, 3)\) Step 3: Let \(t = 2\). \[x = 2 - 3(2) = -4, \quad y = 1 + 2(2) = 5\] Point: \((-4, 5)\) Step 4: Organize and plot.| \(t\) | \(x\) | \(y\) | Point |
| \(0\) | \(2\) | \(1\) | \((2, 1)\) |
| \(1\) | \(-1\) | \(3\) | \((-1, 3)\) |
| \(2\) | \(-4\) | \(5\) | \((-4, 5)\) |