5.2 Graphs and Properties of Exponential Growth and Decay Functions
- Examine properties of exponential functions
- Examine graphs of exponential functions
Forms of Exponential Functions
An exponential function can be written in three equivalent forms:
\[f(x) = ab^x = a(1 + r)^x = ae^{kx}\]| Parameter | Meaning |
|---|---|
| \(a\) | The initial value because \(f(0) = a\). In growth and decay models, \(a > 0\). |
| \(b\) | The growth factor. We restrict \(b > 0\) because even roots of negative numbers are undefined. We need \(b^x\) to be defined for all values of \(x\). |
| \(r\) | The growth or decay rate. In formulas we use \(r\) in decimal form, but in problems we usually state \(r\) as a percent. |
| \(k\) | The continuous growth rate or continuous decay rate. |
Understanding the graph of an exponential function is essential for interpreting real-world data. When you see a graph of population growth, stock prices, or radioactive decay, you're looking at an exponential function. Knowing the properties of these graphs helps you quickly identify whether a quantity is growing or decaying, how fast, and what its long-term behavior will be.
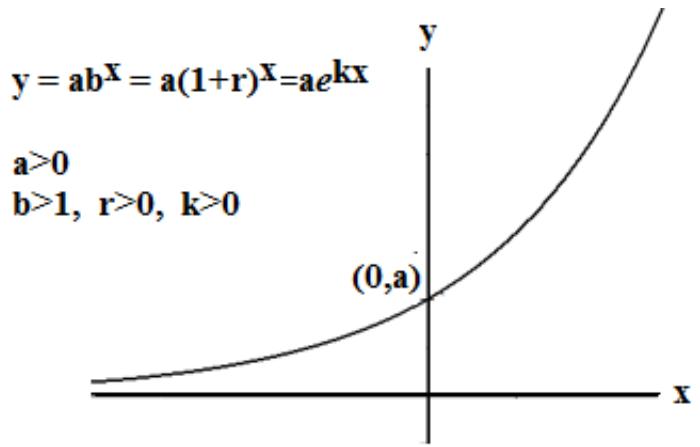
Properties of Exponential Growth Functions
The function \(y = f(x) = ab^x\) represents growth if \(b > 1\) and \(a > 0\).
The growth rate \(r\) is positive when \(b > 1\). Since \(b = 1 + r > 1\), we get \(r = b - 1 > 0\).
Equivalently, \(y = f(x) = ae^{kx}\) represents growth if \(k > 0\) and \(a > 0\).
Key properties:
- The function is an increasing function: \(y\) increases as \(x\) increases
- Domain: All real numbers — any real number can be input
- Range: If \(a > 0\), the range is the set of positive real numbers (the graph is always above the \(x\)-axis)
- Horizontal asymptote: The negative \(x\)-axis. As \(x \to -\infty\), \(y \to 0\)
- Vertical intercept: The point \((0, a)\) on the \(y\)-axis
- No horizontal intercept: The function never crosses the \(x\)-axis
Think of the horizontal asymptote as a "floor" that the graph approaches but never touches. For a growth function, this floor is on the left side of the graph. As you move to the right, the function shoots upward without bound. As you move to the left, the function gets closer and closer to zero but never reaches it.
Properties of Exponential Decay Functions
The function \(y = f(x) = ab^x\) represents decay if \(0 < b < 1\) and \(a > 0\).
The growth rate \(r\) is negative when \(0 < b < 1\). Since \(b = 1 + r < 1\), we get \(r = b - 1 < 0\).
Equivalently, \(y = f(x) = ae^{kx}\) represents decay if \(k < 0\) and \(a > 0\).
Key properties:
- The function is a decreasing function: \(y\) decreases as \(x\) increases
- Domain: All real numbers
- Range: If \(a > 0\), the range is the set of positive real numbers (the graph is always above the \(x\)-axis)
- Horizontal asymptote: The positive \(x\)-axis. As \(x \to \infty\), \(y \to 0\)
- Vertical intercept: The point \((0, a)\) on the \(y\)-axis
- No horizontal intercept: The function never crosses the \(x\)-axis
The graphs below compare exponential growth and decay:
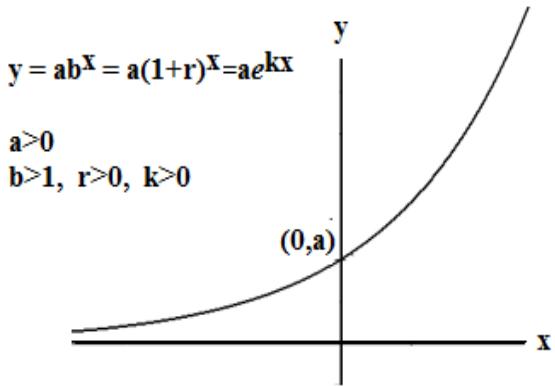
EXPONENTIAL GROWTH
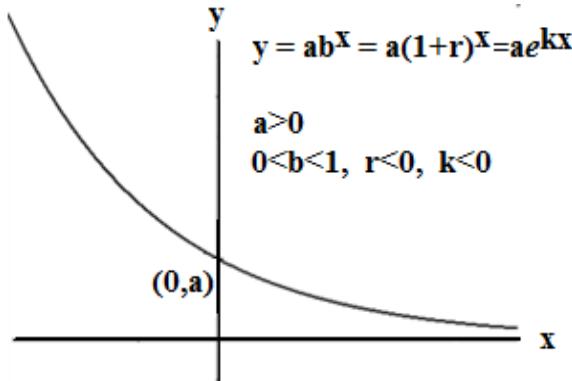
EXPONENTIAL DECAY
Notice that growth and decay are mirror images in behavior:
- Growth starts slow (near the asymptote on the left) and accelerates to the right
- Decay starts high (at the initial value) and slows down as it approaches the asymptote on the right
- Both curves pass through the point \((0, a)\) — the initial value
- Neither curve ever touches the \(x\)-axis
An Exponential Function Is a One-to-One Function
Look at the graph of any exponential function: each \(y\) value on the graph occurs only once. This means every \(y\) value in the range corresponds to exactly one \(x\) value. This property is called one-to-one.
Because an exponential function is one-to-one, for any particular output \(y\), you can uniquely determine the corresponding input \(x\). This means every exponential function has an inverse function.
The inverse function of an exponential function is a logarithmic function, which we will investigate in the next section.
Why does "one-to-one" matter? Because it guarantees we can "undo" the exponential function. If you know a bank account has $15,000 and it started with $10,000 growing at 5% per year, you can find exactly how many years it took. The logarithm — the inverse of the exponential — is the tool that lets you solve for time in growth and decay problems.
\(x\) years after the year 2015, the population of the city of Fulton is given by:
\[y = f(x) = 35000(1.03^x)\]\(x\) years after the year 2015, the population of the city of Greenville is given by:
\[y = g(x) = 80000(0.95^x)\]Compare the graphs of these functions.
Example 5.2.1 Solution
| Population of Fulton | Population of Greenville | |
|---|---|---|
| Function | \(y = f(x) = 35000(1.03^x)\) | \(y = g(x) = 80000(0.95^x)\) |
| Type | Exponential Growth (\(b = 1.03 > 1\), \(r = 0.03 > 0\)) | Exponential Decay (\(b = 0.95 < 1\), \(r = -0.05 < 0\)) |
| \(y\)-intercept | \((0, 35000)\) — Initial population in 2015 is 35,000 | \((0, 80000)\) — Initial population in 2015 is 80,000 |
| Asymptote | Negative \(x\)-axis: \(y \to 0\) as \(x \to -\infty\) | Positive \(x\)-axis: \(y \to 0\) as \(x \to \infty\) |
Domain: In general, the domain of both functions is the set of all real numbers.
Range: The range of both functions is the set of positive real numbers. Both graphs always lie above the \(x\)-axis.
Domain and Range in context of this problem:
The functions represent population size as a function of time after 2015. We restrict the domain to the practical domain of non-negative real numbers: \(x \geq 0\). Then we consider only the portion of the graph in the first quadrant.
- For the growth function \(y = f(x) = 35000(1.03^x)\) with \(x \geq 0\): the range is \(y \geq 35{,}000\)
- For the decay function \(y = g(x) = 80000(0.95^x)\) with \(x \geq 0\): the range is \(y \leq 80{,}000\)
Problem Set 5.2
Problem Set 5.2
In questions 1–4, let \(t\) = time in years and \(y\) = the value at time \(t\) or the size of the population at time \(t\). The domain is \(t \geq 0\) because \(y\) represents a physical quantity and negative values for time may not make sense. For each question:
a. Write the formula for the function in the form \(y = ab^t\)
b. Sketch the graph of the function and mark the coordinates of the \(y\)-intercept.
1. A house was purchased for $350,000 in the year 2010. The value has been increasing at the rate of 2% per year.
Problem 1 Solution
Step 1: Identify the parameters from the problem statement.
The initial value is the purchase price: \(a = 350{,}000\).
The value is increasing at 2% per year, so the growth rate is \(r = 0.02\).
Step 2: Compute the growth factor \(b\).
\[b = 1 + r = 1 + 0.02 = 1.02\]Since \(b = 1.02 > 1\), this confirms exponential growth.
Step 3: Write the formula in the form \(y = ab^t\).
\[\boxed{y = 350{,}000(1.02)^t}\]where \(t\) is the number of years after 2010.
Step 4: Determine graphing features.
- \(y\)-intercept: Set \(t = 0\): \(y = 350{,}000(1.02)^0 = 350{,}000(1) = 350{,}000\). The \(y\)-intercept is \((0,\; 350{,}000)\).
- Behavior: The graph is an increasing exponential curve starting at \((0, 350{,}000)\) and rising as \(t\) increases.
- Asymptote: \(y = 0\) (the \(t\)-axis), approached as \(t \to -\infty\).
- Practical domain: \(t \geq 0\) (years after 2010).
Verification: At \(t = 1\): \(y = 350{,}000(1.02)^1 = 350{,}000 \times 1.02 = 357{,}000\). This is a 2% increase over $350,000, which equals \(350{,}000 \times 0.02 = 7{,}000\) more. \(350{,}000 + 7{,}000 = 357{,}000\) ✓
2. A population of a certain species of bird in a state park has 300 birds. The population is decreasing at the rate of 7% per year.
Problem 2 Solution
Step 1: Identify the parameters from the problem statement.
The initial population is \(a = 300\) birds.
The population is decreasing at 7% per year, so the decay rate is \(r = -0.07\).
Step 2: Compute the growth factor \(b\).
\[b = 1 + r = 1 + (-0.07) = 0.93\]Since \(0 < b = 0.93 < 1\), this confirms exponential decay.
Step 3: Write the formula in the form \(y = ab^t\).
\[\boxed{y = 300(0.93)^t}\]where \(t\) is the number of years from the start.
Step 4: Determine graphing features.
- \(y\)-intercept: Set \(t = 0\): \(y = 300(0.93)^0 = 300(1) = 300\). The \(y\)-intercept is \((0, 300)\).
- Behavior: The graph is a decreasing exponential curve starting at \((0, 300)\) and falling toward \(y = 0\) as \(t\) increases.
- Asymptote: \(y = 0\) (the \(t\)-axis), approached as \(t \to \infty\).
- Practical domain: \(t \geq 0\).
Verification: At \(t = 1\): \(y = 300(0.93)^1 = 300 \times 0.93 = 279\). A 7% decrease from 300 is \(300 \times 0.07 = 21\), so \(300 - 21 = 279\) ✓
3. A lab buys equipment for $50,000. Its value depreciates over time. The value decreases at the rate of 6% annually.
Problem 3 Solution
Step 1: Identify the parameters from the problem statement.
The initial value of the equipment is \(a = 50{,}000\).
The value decreases (depreciates) at 6% per year, so the decay rate is \(r = -0.06\).
Step 2: Compute the growth factor \(b\).
\[b = 1 + r = 1 + (-0.06) = 0.94\]Since \(0 < b = 0.94 < 1\), this confirms exponential decay.
Step 3: Write the formula in the form \(y = ab^t\).
\[\boxed{y = 50{,}000(0.94)^t}\]where \(t\) is the number of years after purchase.
Step 4: Determine graphing features.
- \(y\)-intercept: Set \(t = 0\): \(y = 50{,}000(0.94)^0 = 50{,}000(1) = 50{,}000\). The \(y\)-intercept is \((0,\; 50{,}000)\).
- Behavior: The graph is a decreasing exponential curve starting at \((0, 50{,}000)\) and falling toward \(y = 0\) as \(t\) increases.
- Asymptote: \(y = 0\) (the \(t\)-axis), approached as \(t \to \infty\).
- Practical domain: \(t \geq 0\).
Verification: At \(t = 1\): \(y = 50{,}000(0.94)^1 = 50{,}000 \times 0.94 = 47{,}000\). A 6% decrease from $50,000 is \(50{,}000 \times 0.06 = 3{,}000\), so \(50{,}000 - 3{,}000 = 47{,}000\) ✓
4. A population of bats in a cave has 200 bats. The population is increasing at the rate of 5% annually.
Problem 4 Solution
Step 1: Identify the parameters from the problem statement.
The initial population is \(a = 200\) bats.
The population is increasing at 5% per year, so the growth rate is \(r = 0.05\).
Step 2: Compute the growth factor \(b\).
\[b = 1 + r = 1 + 0.05 = 1.05\]Since \(b = 1.05 > 1\), this confirms exponential growth.
Step 3: Write the formula in the form \(y = ab^t\).
\[\boxed{y = 200(1.05)^t}\]where \(t\) is the number of years from the start.
Step 4: Determine graphing features.
- \(y\)-intercept: Set \(t = 0\): \(y = 200(1.05)^0 = 200(1) = 200\). The \(y\)-intercept is \((0, 200)\).
- Behavior: The graph is an increasing exponential curve starting at \((0, 200)\) and rising as \(t\) increases.
- Asymptote: \(y = 0\) (the \(t\)-axis), approached as \(t \to -\infty\).
- Practical domain: \(t \geq 0\).
Verification: At \(t = 1\): \(y = 200(1.05)^1 = 200 \times 1.05 = 210\). A 5% increase from 200 is \(200 \times 0.05 = 10\), so \(200 + 10 = 210\) ✓
In questions 5–8, let \(t\) = time in years and \(y\) = the value at time \(t\) or the size of the population at time \(t\). The domain is \(t \geq 0\). For each question:
a. Write the formula for the function in the form \(y = ae^{kt}\)
b. Sketch the graph of the function and mark the coordinates of the \(y\)-intercept.
5. A population of 400 microbes increases at the continuous growth rate of 26% per day.
Problem 5 Solution
Step 1: Identify the parameters from the problem statement.
The initial population is \(a = 400\) microbes.
The continuous growth rate is 26% per day, so \(k = 0.26\) (positive because the population is increasing).
Step 2: Write the formula in the form \(y = ae^{kt}\).
\[\boxed{y = 400e^{0.26t}}\]where \(t\) is the number of days from the start.
Step 3: Verify this is a growth function.
Since \(k = 0.26 > 0\) and \(a = 400 > 0\), this is an exponential growth function.
Step 4: Determine graphing features.
- \(y\)-intercept: Set \(t = 0\): \(y = 400e^{0.26(0)} = 400e^0 = 400(1) = 400\). The \(y\)-intercept is \((0, 400)\).
- Behavior: The graph is an increasing exponential curve starting at \((0, 400)\) and rising rapidly as \(t\) increases.
- Asymptote: \(y = 0\) (the \(t\)-axis), approached as \(t \to -\infty\).
- Practical domain: \(t \geq 0\).
Verification: At \(t = 1\): \(y = 400e^{0.26(1)} = 400e^{0.26} \approx 400(1.2969) \approx 518.8\). Since the population grew from 400 to about 519 in one day, that's an increase of about 119 microbes, or roughly \(\frac{119}{400} \approx 29.7\%\) — consistent with a 26% continuous rate (the effective rate is \(e^{0.26} - 1 \approx 0.297 = 29.7\%\)) ✓
6. The price of a machine needed by a production factory is $28,000. Due to inflation the price of the machine is increasing at the continuous rate of 3.5% per year.
Problem 6 Solution
Step 1: Identify the parameters from the problem statement.
The initial price is \(a = 28{,}000\).
The price is increasing at a continuous rate of 3.5% per year, so \(k = 0.035\) (positive for growth).
Step 2: Write the formula in the form \(y = ae^{kt}\).
\[\boxed{y = 28{,}000e^{0.035t}}\]where \(t\) is the number of years from now.
Step 3: Verify this is a growth function.
Since \(k = 0.035 > 0\) and \(a = 28{,}000 > 0\), this is an exponential growth function.
Step 4: Determine graphing features.
- \(y\)-intercept: Set \(t = 0\): \(y = 28{,}000e^{0.035(0)} = 28{,}000e^0 = 28{,}000(1) = 28{,}000\). The \(y\)-intercept is \((0,\; 28{,}000)\).
- Behavior: The graph is an increasing exponential curve starting at \((0, 28{,}000)\) and rising as \(t\) increases.
- Asymptote: \(y = 0\) (the \(t\)-axis), approached as \(t \to -\infty\).
- Practical domain: \(t \geq 0\).
Verification: At \(t = 1\): \(y = 28{,}000e^{0.035} \approx 28{,}000(1.03562) \approx 28{,}997\). The price increased by about $997, which is roughly \(\frac{997}{28{,}000} \approx 3.56\%\) — consistent with a 3.5% continuous rate (effective rate \(= e^{0.035} - 1 \approx 0.0356 = 3.56\%\)) ✓
7. A population of an endangered species consists of 4,000 animals of that species. The population is decreasing at the continuous rate of 12% per year.
Problem 7 Solution
Step 1: Identify the parameters from the problem statement.
The initial population is \(a = 4{,}000\) animals.
The population is decreasing at a continuous rate of 12% per year, so \(k = -0.12\) (negative because the population is declining).
Step 2: Write the formula in the form \(y = ae^{kt}\).
\[\boxed{y = 4{,}000e^{-0.12t}}\]where \(t\) is the number of years from now.
Step 3: Verify this is a decay function.
Since \(k = -0.12 < 0\) and \(a = 4{,}000 > 0\), this is an exponential decay function.
Step 4: Determine graphing features.
- \(y\)-intercept: Set \(t = 0\): \(y = 4{,}000e^{-0.12(0)} = 4{,}000e^0 = 4{,}000(1) = 4{,}000\). The \(y\)-intercept is \((0,\; 4{,}000)\).
- Behavior: The graph is a decreasing exponential curve starting at \((0, 4{,}000)\) and falling toward \(y = 0\) as \(t\) increases.
- Asymptote: \(y = 0\) (the \(t\)-axis), approached as \(t \to \infty\).
- Practical domain: \(t \geq 0\).
Verification: At \(t = 1\): \(y = 4{,}000e^{-0.12} \approx 4{,}000(0.88692) \approx 3{,}548\). The population decreased by about 452, which is \(\frac{452}{4{,}000} \approx 11.3\%\) — consistent with a 12% continuous decay rate (effective rate \(= 1 - e^{-0.12} \approx 0.1131 = 11.3\%\)) ✓
8. A business buys a computer system for $12,000. The value of the system is depreciating and decreases at the continuous rate of 20% per year.
Problem 8 Solution
Step 1: Identify the parameters from the problem statement.
The initial value of the computer system is \(a = 12{,}000\).
The value is depreciating at a continuous rate of 20% per year, so \(k = -0.20\) (negative because the value is decreasing).
Step 2: Write the formula in the form \(y = ae^{kt}\).
\[\boxed{y = 12{,}000e^{-0.20t}}\]where \(t\) is the number of years after purchase.
Step 3: Verify this is a decay function.
Since \(k = -0.20 < 0\) and \(a = 12{,}000 > 0\), this is an exponential decay function.
Step 4: Determine graphing features.
- \(y\)-intercept: Set \(t = 0\): \(y = 12{,}000e^{-0.20(0)} = 12{,}000e^0 = 12{,}000(1) = 12{,}000\). The \(y\)-intercept is \((0,\; 12{,}000)\).
- Behavior: The graph is a decreasing exponential curve starting at \((0, 12{,}000)\) and falling toward \(y = 0\) as \(t\) increases.
- Asymptote: \(y = 0\) (the \(t\)-axis), approached as \(t \to \infty\).
- Practical domain: \(t \geq 0\).
Verification: At \(t = 1\): \(y = 12{,}000e^{-0.20} \approx 12{,}000(0.81873) \approx 9{,}825\). The value decreased by about $2,175, which is \(\frac{2{,}175}{12{,}000} \approx 18.1\%\) — consistent with a 20% continuous decay rate (effective rate \(= 1 - e^{-0.20} \approx 0.1813 = 18.1\%\)) ✓
For questions 9–12:
a. Sketch a graph of the exponential function
b. List the coordinates of the \(y\)-intercept
c. State the equation of any asymptotes and state whether the function approaches the asymptote as \(x \to \infty\) or as \(x \to -\infty\)
d. State the domain and range
9. \(y = 10(1.5^x)\)
Problem 9 Solution
Step 1: Identify the type of exponential function.
The function is \(y = 10(1.5^x)\). Here \(a = 10\) and \(b = 1.5\).
Since \(b = 1.5 > 1\) and \(a = 10 > 0\), this is an exponential growth function.
The growth rate is \(r = b - 1 = 1.5 - 1 = 0.5 = 50\%\).
(a) Compute a few key points:
- At \(x = -2\): \(y = 10(1.5^{-2}) = 10 \cdot \frac{1}{2.25} \approx 4.44\)
- At \(x = -1\): \(y = 10(1.5^{-1}) = 10 \cdot \frac{1}{1.5} \approx 6.67\)
- At \(x = 0\): \(y = 10(1.5^0) = 10(1) = 10\)
- At \(x = 1\): \(y = 10(1.5^1) = 10(1.5) = 15\)
- At \(x = 2\): \(y = 10(1.5^2) = 10(2.25) = 22.5\)
- At \(x = 3\): \(y = 10(1.5^3) = 10(3.375) = 33.75\)
The graph is an increasing curve that rises steeply to the right and flattens toward \(y = 0\) on the left.
(b) \(y\)-intercept: \(y = 10(1.5^0) = 10(1) = 10\). The \(y\)-intercept is \((0, 10)\).
(c) Asymptote: \(y = 0\) (the \(x\)-axis). The function approaches this asymptote as \(x \to -\infty\). As \(x\) becomes very negative, \(1.5^x \to 0\), so \(y \to 0\).
(d) Domain: All real numbers \((-\infty, \infty)\). Range: \(y > 0\), or \((0, \infty)\). The function is always positive and never equals zero.
Verification: At \(x = 0\), \(y = 10\) ✓. At \(x = 2\), \(y = 10(2.25) = 22.5\), and \(22.5 > 10\), confirming the function is increasing ✓
10. \(y = 10(e^{1.2x})\)
Problem 10 Solution
Step 1: Identify the type of exponential function.
The function is \(y = 10e^{1.2x}\). Here \(a = 10\) and \(k = 1.2\).
Since \(k = 1.2 > 0\) and \(a = 10 > 0\), this is an exponential growth function.
We can convert to the \(y = ab^x\) form: \(b = e^{1.2} \approx 3.32\), confirming \(b > 1\) (growth).
(a) Compute a few key points:
- At \(x = -1\): \(y = 10e^{1.2(-1)} = 10e^{-1.2} \approx 10(0.3012) \approx 3.01\)
- At \(x = 0\): \(y = 10e^{0} = 10(1) = 10\)
- At \(x = 1\): \(y = 10e^{1.2} \approx 10(3.3201) \approx 33.20\)
- At \(x = 2\): \(y = 10e^{2.4} \approx 10(11.023) \approx 110.2\)
The graph rises very steeply to the right and flattens toward \(y = 0\) on the left.
(b) \(y\)-intercept: \(y = 10e^{1.2(0)} = 10e^0 = 10(1) = 10\). The \(y\)-intercept is \((0, 10)\).
(c) Asymptote: \(y = 0\) (the \(x\)-axis). The function approaches this asymptote as \(x \to -\infty\). As \(x\) becomes very negative, \(e^{1.2x} \to 0\), so \(y \to 0\).
(d) Domain: All real numbers \((-\infty, \infty)\). Range: \(y > 0\), or \((0, \infty)\). The function is always positive and never equals zero.
Verification: At \(x = 0\), \(y = 10\) ✓. At \(x = 1\), \(y \approx 33.20 > 10\), confirming the function is increasing ✓
11. \(y = 32(0.75^x)\)
Problem 11 Solution
Step 1: Identify the type of exponential function.
The function is \(y = 32(0.75^x)\). Here \(a = 32\) and \(b = 0.75\).
Since \(0 < b = 0.75 < 1\) and \(a = 32 > 0\), this is an exponential decay function.
The decay rate is \(r = b - 1 = 0.75 - 1 = -0.25\), so the function decreases at 25% per unit of \(x\).
(a) Compute a few key points:
- At \(x = -2\): \(y = 32(0.75^{-2}) = 32 \cdot \frac{1}{0.5625} \approx 56.89\)
- At \(x = -1\): \(y = 32(0.75^{-1}) = 32 \cdot \frac{1}{0.75} \approx 42.67\)
- At \(x = 0\): \(y = 32(0.75^0) = 32(1) = 32\)
- At \(x = 1\): \(y = 32(0.75^1) = 32(0.75) = 24\)
- At \(x = 2\): \(y = 32(0.75^2) = 32(0.5625) = 18\)
- At \(x = 4\): \(y = 32(0.75^4) = 32(0.3164) \approx 10.12\)
The graph starts high on the left and decreases toward \(y = 0\) on the right.
(b) \(y\)-intercept: \(y = 32(0.75^0) = 32(1) = 32\). The \(y\)-intercept is \((0, 32)\).
(c) Asymptote: \(y = 0\) (the \(x\)-axis). The function approaches this asymptote as \(x \to \infty\). As \(x\) becomes very large, \(0.75^x \to 0\), so \(y \to 0\).
(d) Domain: All real numbers \((-\infty, \infty)\). Range: \(y > 0\), or \((0, \infty)\). The function is always positive and never equals zero.
Verification: At \(x = 0\), \(y = 32\) ✓. At \(x = 1\), \(y = 24 < 32\), confirming the function is decreasing ✓. Check: \(32 \times 0.75 = 24\) ✓
12. \(y = 200(e^{-5x})\)
Problem 12 Solution
Step 1: Identify the type of exponential function.
The function is \(y = 200e^{-5x}\). Here \(a = 200\) and \(k = -5\).
Since \(k = -5 < 0\) and \(a = 200 > 0\), this is an exponential decay function.
We can convert to the \(y = ab^x\) form: \(b = e^{-5} \approx 0.00674\), confirming \(0 < b < 1\) (decay). This function decays very rapidly.
(a) Compute a few key points:
- At \(x = -0.5\): \(y = 200e^{-5(-0.5)} = 200e^{2.5} \approx 200(12.182) \approx 2{,}436\)
- At \(x = 0\): \(y = 200e^{0} = 200(1) = 200\)
- At \(x = 0.2\): \(y = 200e^{-1} \approx 200(0.3679) \approx 73.6\)
- At \(x = 0.5\): \(y = 200e^{-2.5} \approx 200(0.0821) \approx 16.4\)
- At \(x = 1\): \(y = 200e^{-5} \approx 200(0.00674) \approx 1.35\)
The graph drops very steeply from left to right, approaching \(y = 0\) rapidly.
(b) \(y\)-intercept: \(y = 200e^{-5(0)} = 200e^0 = 200(1) = 200\). The \(y\)-intercept is \((0, 200)\).
(c) Asymptote: \(y = 0\) (the \(x\)-axis). The function approaches this asymptote as \(x \to \infty\). As \(x\) becomes very large, \(e^{-5x} \to 0\), so \(y \to 0\).
(d) Domain: All real numbers \((-\infty, \infty)\). Range: \(y > 0\), or \((0, \infty)\). The function is always positive and never equals zero.
Verification: At \(x = 0\), \(y = 200\) ✓. At \(x = 1\), \(y \approx 1.35 < 200\), confirming the function is rapidly decreasing ✓